REALTIME
This screen allows you to monitor Oracle performance indicators in real time. It consists of two main screens, Realtime and Active Sessions.
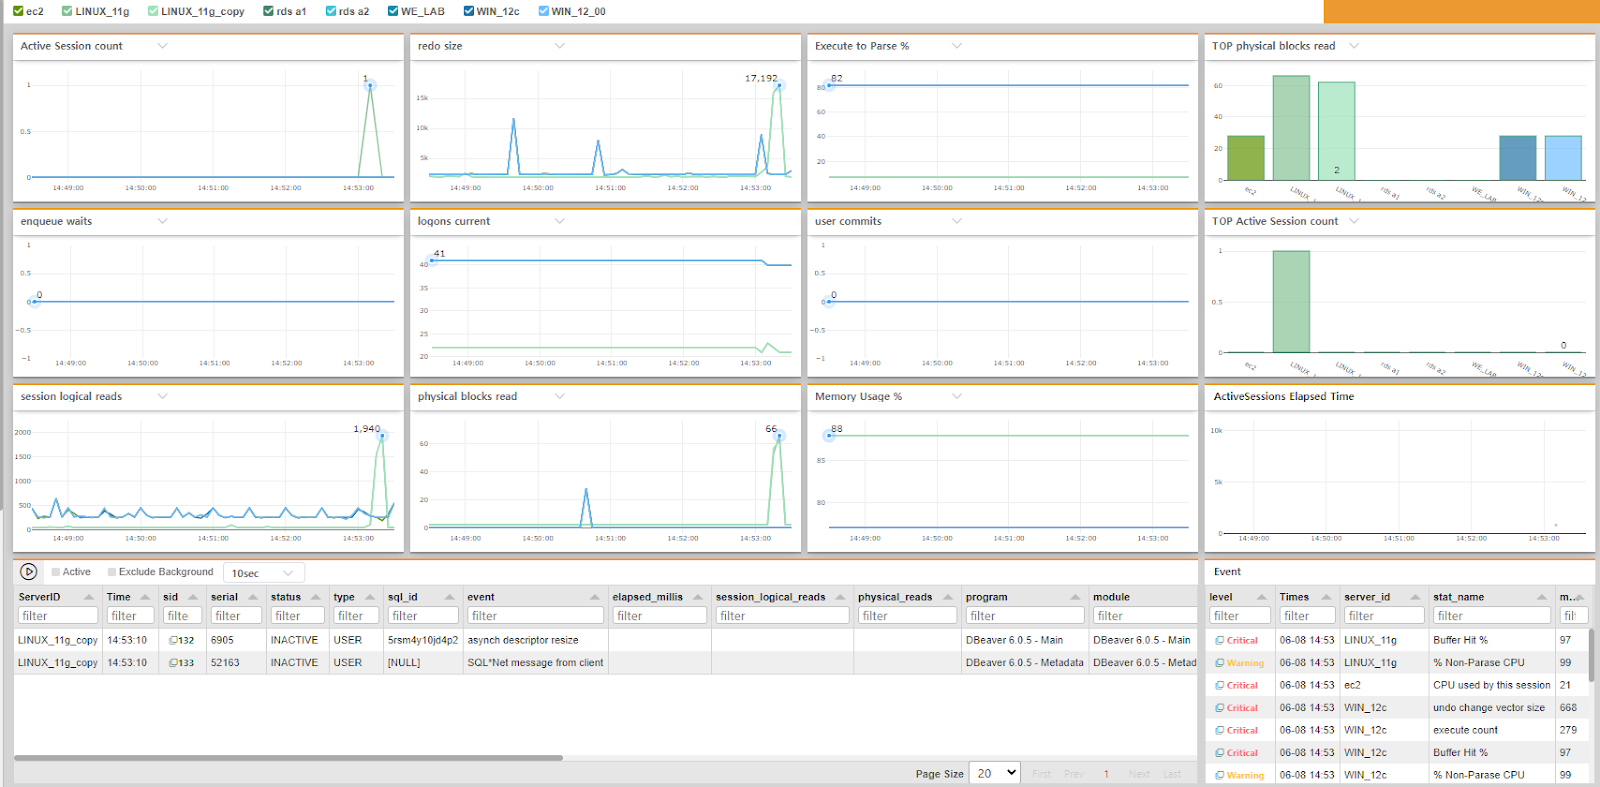
<3-1 Realtime screen shot>
Show Basic Information
- At the top of the screen, you will see the logged-in user information.
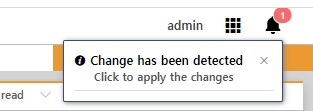
- Alarm is being displayed when setting information for EZIS product has changed and needs to be reflected in the reporting server, restarted process, or refreshed screen (bell-shape).
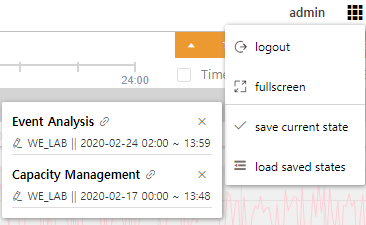
 When you click the icon, it provides logout, full screen view, and save and recall the screen. The Save and Recall screen function saves the server and time information of the screen you are currently monitoring and is available as a bookmark function.
Monitoring Server Selection

Select the monitored server at the top of the screen to monitor only the selected target server.
When you select multiple servers, only the selected monitored servers are displayed on the real-time screen with graphs, etc. If not selected, all target monitoring servers shown at the top of the screen are displayed. If a server is rising as a load factor, you can select only one server to monitor, which is very useful.
Max Value

- In the upper-right corner of the performance graph, it displays the highest index values for the various monitoring servers that the index represents. This is useful for viewing suddenly elevated metrics.
Indicator Change
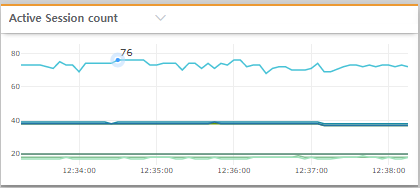
- You can monitor by changing the indicators you are viewing. Click on the name of the indicator to display a list of them that can be changed, and when selected by mouse, it can be changed to the indicator.
- The real-time selectable indicator type can be changed only if the ProcessType is "ON" among the indicators set by Admin. You can set it up under "Admin > Monitoring > StatName" to go to that setting.
Active Session Elapsed Time view
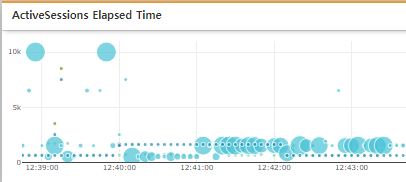
- This is a graphical representation of Elapsed time by session for Active Sessions generated from the monitored server. You can see at a glance how long the average session runs through this graph. A high score in the graph area allows you to intuitively determine that a delay element is occurring in the session. Conversely, if the dots are located at the bottom of the graph, you can determine that the session is communicating well because the average run time is short.
- You can drag the indicator area with the mouse to view the details.
Top Chart
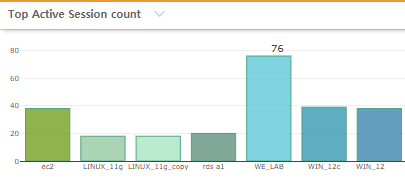
- Top Chart consists of bar chart so that you can visually determine the highest possible section.
- You can change the indicators, and the indicator values are automatically displayed in descending order.
Active Sessions List
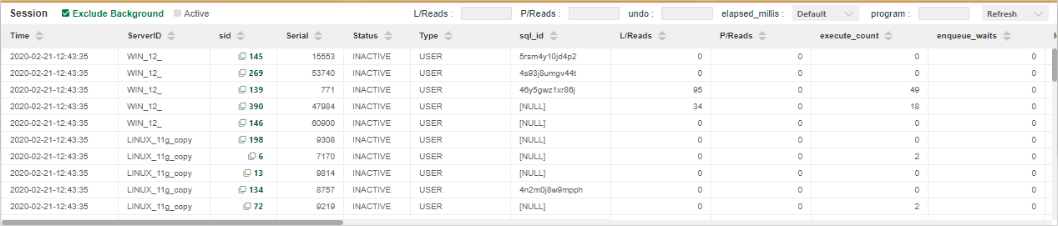
- You can view the incoming Active Session list in real time by sorting or filtering it. You can easily find and remove the root cause of problematic session filtering or alignment against key indicators such as P/Reads and L/Reads.
- Clicking on the SID of the corresponding session takes you to the Detail screen.
- By default, the background session is automatically filtered. If you want to see the Background Session, un-check the check box.
Session Detail
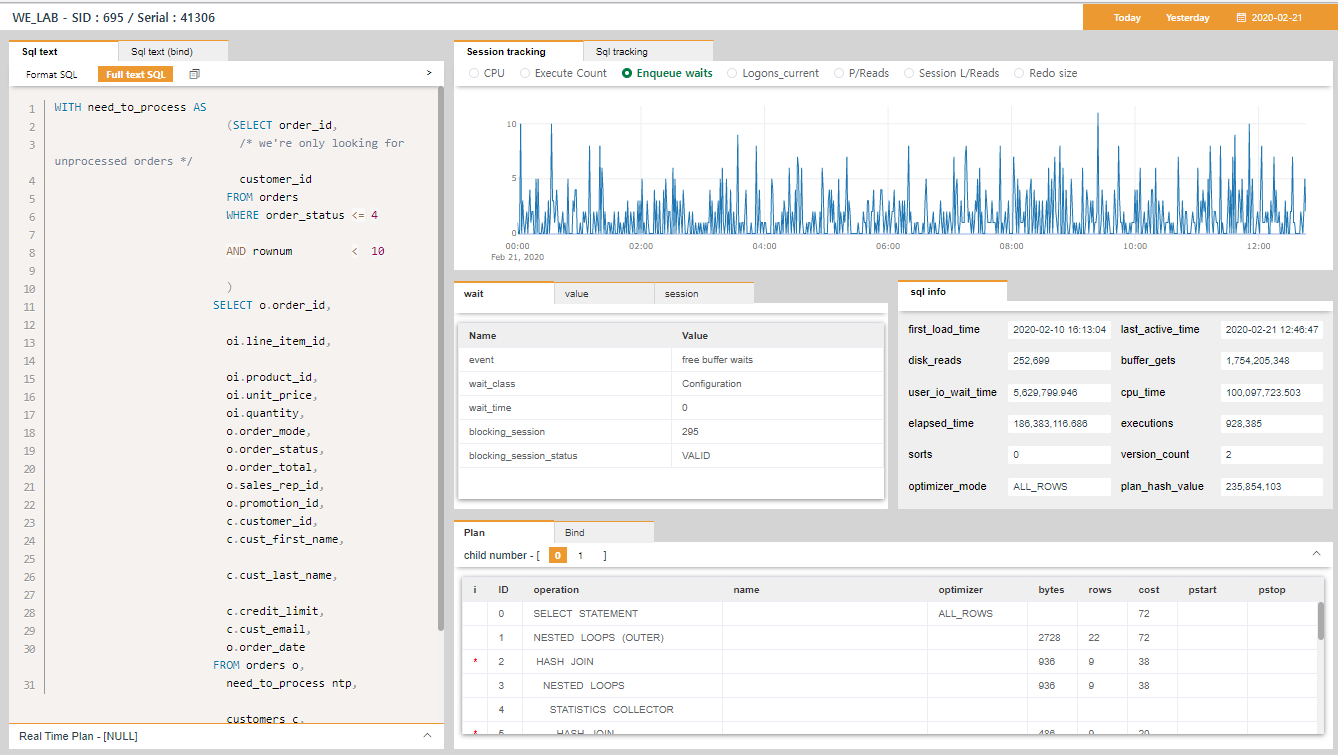
- Provides detailed information about the selected session from the session list.
- In addition to SQL Text, you’ll see the Plan information, Bind value, and various performance indicators over the last five minutes.
- You can sort the SQL syntax in the SQL Text area, and the bind tab automatically inserts the bind variable into the SQL syntax and provides the ability to copy and use it.
- Session Tracking :
- CPU : Displays the Delta value increased or decreased over the previous division in one minute.
- Execute_Count : Displays the Delta value increased or decreased over the previous division in one minute.
- Enqueue_waits : Displays the Delta value increased or decreased over the previous division in one minute.
- Logons_current : Displays the Delta value increased or decreased over the previous division in one minute.
- Physical_Reads : Displays the Delta value increased or decreased over the previous division in one minute.
- Session_logical_Reads : Displays the Delta value increased or decreased over the previous division in one minute.
- Redo_size : Displays the Delta value increased or decreased over the previous division in one minute.
- Click on Session Tracking's indicators to view the data for that time zone.
- Wait : The value of wait indicator of session (current at the time)
- Value : The v$sestat value performed by the session (current at the time)
- Session : The value of wait indicator of session (current at the time)
- Sqlinfo : The sql information collected by sqlarea (current at the time)
- The Plan tab shows PLAN information where sql_id occurred in the selected time zone in Session Tracking. However, if you have multiple children_number, you can select and view them.
- The bind tab shows the bind capture information for the nearest time zone for sql_id. The data is collected at 15 minute intervals, so it is at least within 15 minutes.
- Sql Tracking
- disk_reads : The DELTA value of the previous value in minutes.
- buffer_gets : The DELTA value of the previous value in minutes.
- user_io_wait_time : The DELTA value of the previous value in minutes, and the unit is ms.
- cpu_time : The DELTA value of the previous value in minutes, and the unit is ms.
- elapsed_time : The value of elapsed_time divided by executions. The DELTA value of the previous value in minutes, and the unit is ms.
- unit average performance time"
- Executions : The DELTA value of the previous value in minutes.
Event
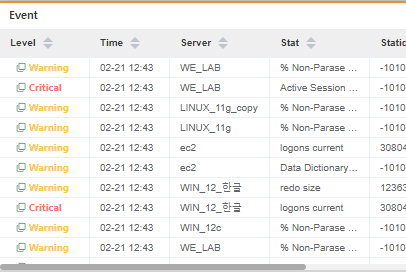
- If the indicator exceeds the threshold set by Admin, it is displayed on the screen in real time.